The expression of several genes (probe sets) can be displayed simultaneously if desired. In order to simplify this only mean profiles of probe sets can be displayed (either the mean of z-score normalised or raw probe pair profiles). These expression patterns are displayed in the 'Mean Plot' window which can be toggled with the 'Mean Plot' button (second from the top in the left button column). This window does not by default show any expression patterns, but these have to be selected either in the history window, or the saved list window. The history window contains the identitites of the last 50 viewed probe sets, which can be saved to the saved list window by clicking on the save button.
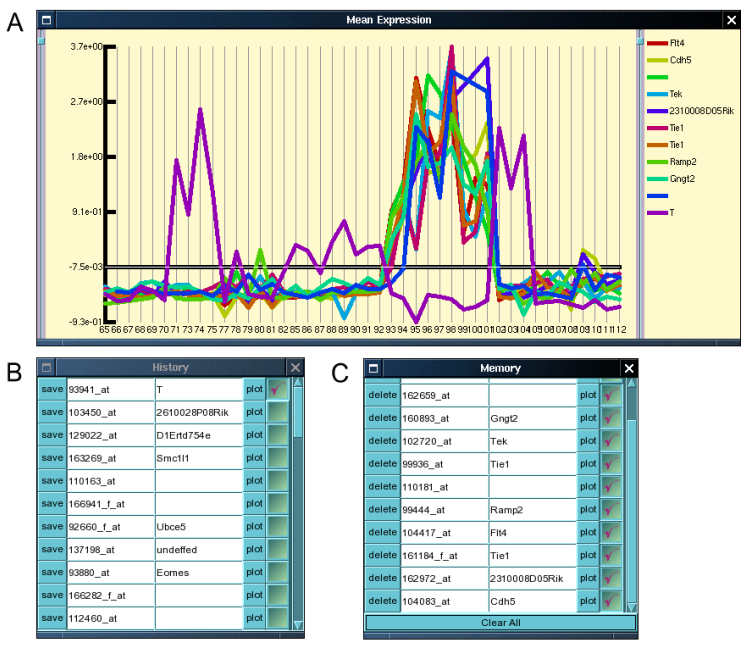
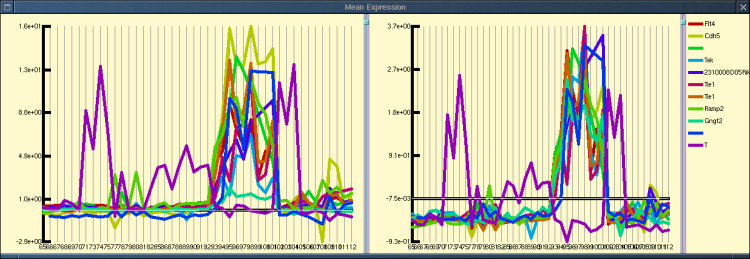
The mean plot window, like the raw data window consists of several panels which can be resized in the horizontal dimension, allowing the simultaenous display of means of raw and means of normalised probe pair profiles (figure 2).