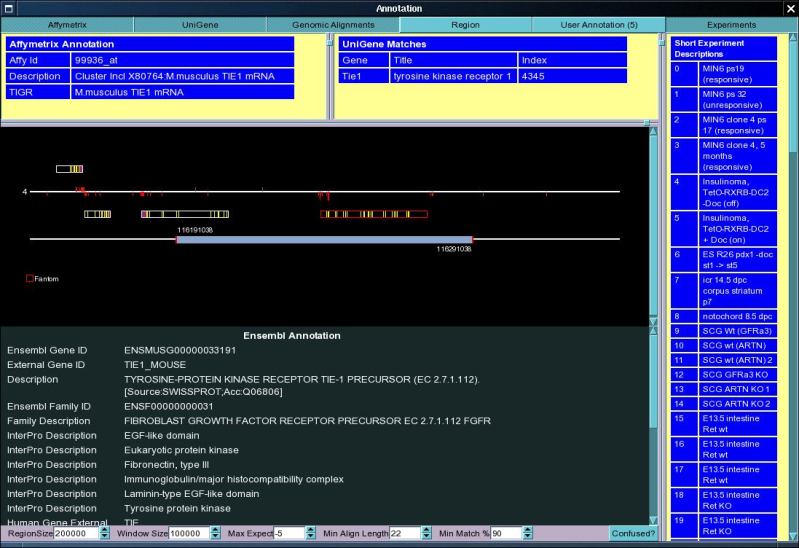
Most of the information displayed requires little explanation, however, the genomic alignments view has a number of hidden capacities which are explained below.
This window displays the set of genomic loci which are associated with
the currently loaded probe set. In addition to displaying the gene structures
located in this region, the window also displays all blast probe set matches
associated with the locus. The window is interactive and allows the user
to zoom in on specific features as well as obtain peptide, mRNA and genomic
sequences from the underlying database. The interactivity makes heavy use
of the three mouse buttons normally used in X11 (the middle button is replaced
with Ctrl Shift for those without a middle button).
| Chromosomal Region |
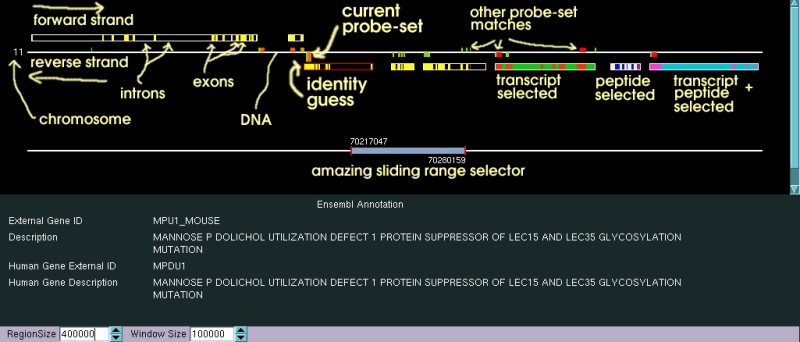
The Chromosomal region currently loaded is represented
by the lower horizontal white line in the above picture, on top of which
is located the "amazing sliding range selector". The sliding range selector
indicates the limits of the currently viewed chromosomal region. The sliding
range selector can be manipulated in three different ways.
|
| Gene Features |
The different transcripts for the genes predicted
by Ensembl are shown either above (for genes lying on the forward strand)
or below (for genes transcribed in the reverse direction). All of the alternative
transcripts predicted are shown along with their intron exon structures.
The limits of the predicted exons are shown with a white rectangle, within
which translated exons are shown in yellow, and untranslated exons (or parts
of exons) are shown in purple (note that the Ensembl predictions for untranslated
exons are frequently rather poor and there are probably lots of missed exons).
One of the genes has its transcript limits displayed with a red box. This
is the gene which the data base system currently predicts the current probe
set is representing. This linkage is based on the positions and qualities
of blast matches to the probe set sequence in the mouse genome. This prediction
is not particularly good or clever, and may be wrong. The user is encouraged
to look at the locus with some care to determine if the prediction is correct
or incorrect. Your poor stressed out administrator welcomes reports of stupid
guesses by the system and will try to improve the system as the trends become
more obvious. When the View is initially loaded the Ensembl Annotation for
the predicted gene is shown in the table below. The annotation for the different
genes shown in the view can be viewed in the table simply by clicking with
the left mouse button on the boxes representing the transcripts. The mRNA and corresponding peptide sequences can be retrieved from the central database system. In order to retrieve sequences from specific transcripts, these have to be selected first. Clicking on a transcript with the right mouse button selects or deselects (if already selected) the mRNA sequence from that transcript and changes the colour scheme of the transcript. Clicking with the middle mouse button (or Ctrl+Left Mouse Button) selects or deselects the protein sequence for that transcript and changes the colour scheme as indicated in the above figure. Both the peptide and the transcript sequence can be selected simultaneously, and their selection is independent of each other. |
| Probe Set Matches |
The Blast probe set matches are indicated along
the white line representing the DNA sequence. Forward strand features are
shown above the strand and blast matches to the reverse strand are shown
below. Matches to the currently selected probe set (the one for which expression
data is shown) is indicated by having twice the height of the other match
features. The colour of a probe set match indicates the random expectation
value given by the blast algorithm, with red for very low (i.e. good) random
expectations, and green for not such good ones (though this will probably
change in the future). The currently viewed probe sets can be loaded into the main index (i.e. allowing their expression data to be viewed) by first selecting the chromosomal regions and strands of interest by clicking either just above or just below the white line representing the DNA strand, and then by right-clicking elsewhere in the widget and selecting save sequences from the popup-menu (more details further down). |