The statistics window provides the user with a means of viewing the distribution of and selecting probe sets on the basis of an arbitrary number of statistical parameters. This window displays both the distribution of statistical parameters and allows the user to view the relationship of selected paramaters either through a two-dimensional distribution plot or through the plotting of points in 3-d space along the x, y and z axes.
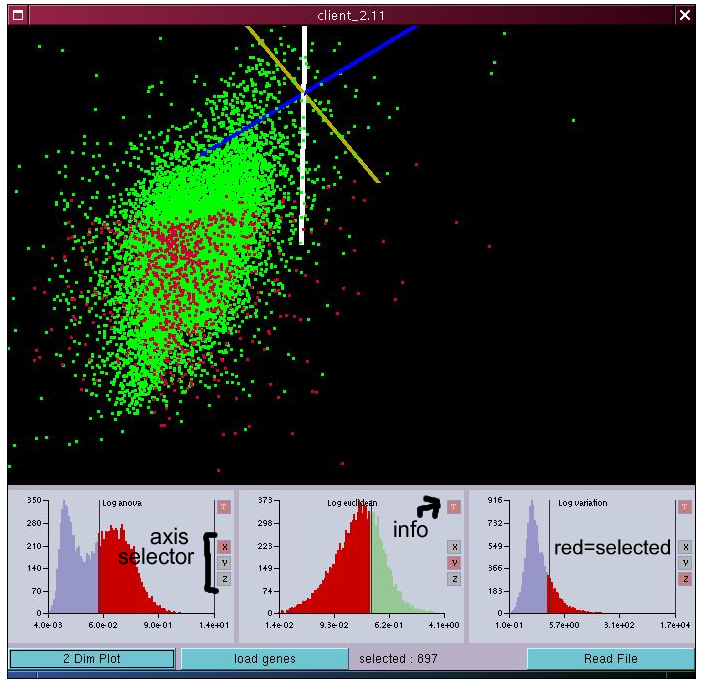
The upper part of the stat window plots the probe sets as points in 3D space, using axis as defined by the distribution widgets underneath using the 'axis selectors' (click and see the effect). Perhaps the most important part of the window is made up by the series of distribution widgets at the bottom. Pressing the left mouse button (anywhere within one of these widgets allows the user to drag a lower (i.e. left side) limit selector for the distribution. Similarly clicking the right mouse button and draggin moves the upper limit selector for the given statistics. The selected region is painted in red, whereas values which become deselected are displayed in pale green or blue. Both upper and lower limits can be changed simultaneously by using the middle mouse button in a similar manner. Double clicking within one distribution widget toggles that widget between using a linear or log scale for the x-axis. The total number of selected probe sets (as an 'AND' intersect of all the statistical paramaters) is displayed on the right hand side of the 'load genes' button on the bottom bar. Ctrl left click, drag up or down on a distribution widget will change the division number of the distribution plot.
Probe sets selected using the distribution widgets can be loaded into the index by using the 'load genes' button. Note that at this moment this can include probe sets originating from unselected chips (see main window array selectors down at the bottom). It is also possible to read in a set of statistics from a file which has been created by some external program. If these are to be used to select probe sets, then they need to contain links to the probe set indices (as defined in the database) rather than by probe set identifiers. However, the stat window itself doesn't care about the probe set id's and can be used as a general multidimensional statistics viewer.
There is also a function that plots two-dimensional distribution plots using a colour scheme. This function can be accessed by clicking the '2 Dim Plot' button in the bottom left hand corner. This is perhaps not that important, but feel free to play around with it. Although this widget can sometimes create quite nice pictures, it uses a complete gaussian blur to smooth the distribution plot and as such is really quite slow. I don't really consider this function as finished, and would encourage those so inclined to improve upon it.