
megaDotter: mega-base dotplots
megaDotter is an implementation of the typical dotplot algorithm for visualising potential alignments between sequences.

Dot Plots
A dot plot is a simple way of displaying the occurence of identical sub-sequences within two sequences. If two sequences, s1 and s2 are compared, then a moving window of s1 (A) of a specified size (eg. if 4, then positions 1-4, 2-5, 3-6, etc.) are compared against all positions of s2. Points are plotted where matching sequences are found; eg, if s1(1-4) is identical to s2(8-11) then a point is plotted at position 1,8 (B). If a sequence is compared to itself, then matches will always be found along the diagonal (i.e. s1(m-n) is always identical to s2(m-n)); additionally if a subsequence is repeated, then additional points will be plotted indicating direct repeats. Inverted repeats can be found by comparing a DNA sequence to its reverse complement. In the megaDotter plots shown (eg. C), 4 Mbp genomic sequences were compared to themselves and their direct repeats using a 100 bp window. Red points indicate direct repeats (i.e. self-comparison) whereas green points indicate inverted repeats.
megaDotter was written specifically to visualise direct and inverted repeats in
reasonably large genomic loci (~mega base size). As such, it only allows
self-comparisons at the current time, though it should be fairly simple to
extend it to allow comparisons with other sequences.
megaDotter uses an STL map to index sequences of a specified length. This makes it
reasonably fast and allows fairly large sequences to be visualised. I don’t know
how well it compares to other similar programs as I have not made any direct
comparisons. It was some time ago that I wrote it, and I ended up writing
it as I could not get the usual alternatives to handle sufficiently long
sequences.
The origins of megaDotter
A long time ago, I was looking at microarray data to identify genes whose
expression decrease rapidly upon mouse embryonic stem cell (ESC)
differentiation. Most genes I found were fairly well characterised, but one
of the most interesting genes stood out as a bit of an oddity. That gene, Rex2,
was in fact identified a long time ago as a gene whose expression was reduced
upon differentiation of an embryonal carcinoma (EC) cell line. In fact it was
identified in the same screen that identified Rex1, which has gone on to become
a very famous marker of the undifferentiated mouse ESC state. Like Rex1 it is
also contains a Zinc finger domain, and other transactivation domains, suggesting
that it's also a transcription factor. So it seemed a little bit strange that noone
I asked had ever heard of this gene.
The answer (probably at least) turns out to be related to it's genomic locus. Looking
at where the (Affymetrix) probe set matched to, I found that it matched in multiple
locations in the same extended gene locus. I also saw that the locus contained a whole
bunch of genes in both orientations, the majority of which looked like complete Zn-finger
transcription factors or contained fragments from Rex2. It looked really rather messy.
To try and get some overview of the relationships of the different regions I went looking
for some programs to visualise the direct and inverted repeats obviously present at
the locus. I was unable to get the typical dotplot programs to give me a picture, so
I wrote my own.
And it looked like this:
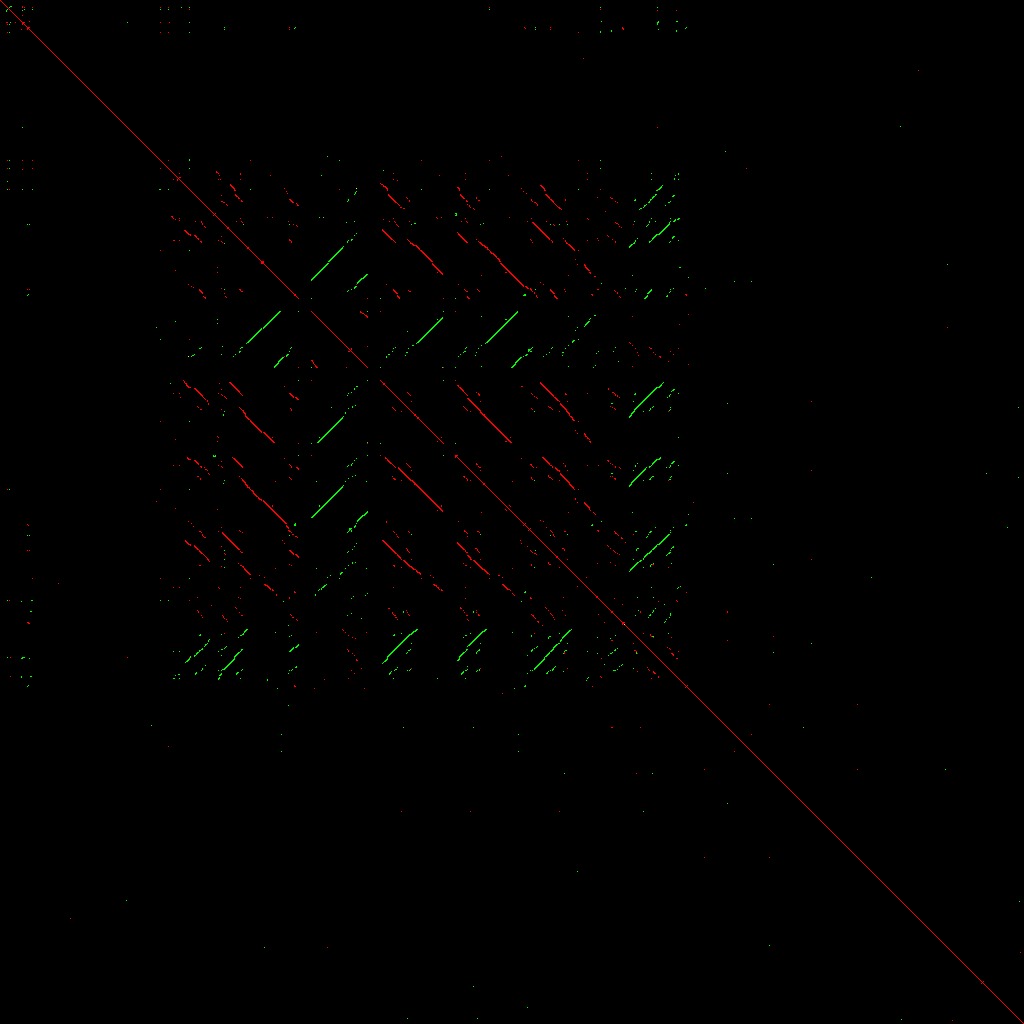
Direct (red) and inverted (green) repeats over a 4 mega-base pair region
at the mouse Rex2 locus.
A complete mess in other words. And certainly good enough a reason to avoid trying to
do any gene targetting. Perhaps the reason why noone has bothered to look at Rex2 in
any great detail.
However, what struck me was how sharply defined the area of repeats was to the surrounding
genomic region. So, I wondered, well, how common is this kind of feature, and not really
finding much answer in the literature, I divided up the genome into 4 Mb regions and made
a picture for each one. The answer is: you can find a few of these regions on
most chromosomes, but really not that many. Several are associated with fairly well
described genes, such as the Rhox cluster and the Zscan4 and the Tex1 loci.
From what I've heard, it used to be thought that these kind of clusters are enriched on
the sex chromosomes. However, my observations do not really agree with this. As to whether
these loci are selected for or are simply the byproduct of some incidental process I
really don't know. I suspect the answer may vary from locus to locus.