N-dimensional relationships

The following images visualise the relationships between objects in N-dimensional space using the R-implementation of the SOD algorithm. The objects are biological samples or individual cells which have been characterised by gene expression measured either globally (i.e. array or RNA-seq) or for a small number of genes in individual cells by counting individual RNA molecules.

Etv2 and its direct targets
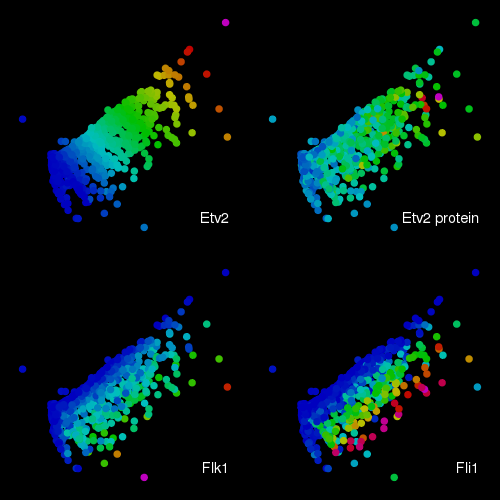
SOD multidimensional mapping of the relationships between the transcriptional identities of 874 cells

Transcripts from a dox inducible EGFP-Etv2 transcription factor and the Flk1, Fli1, Cdh5, Snail1 and Pdgfra genes were enumerated by combinatorial FISH. In addition, the amount of EGFP-Etv2 fusion protein was estimated from direct EGFP fluorescence. The transcript densities were used to determine the global set of relationships between the cells and these were reduced from 6 to 2 dimensions using the SOD algorithm. The colouring in the individual plots indicate the relative levels of either transcriptional densities or the estimated EGFP-Etv2 protein amounts.
Click image for the scalable svg file.

Effect of Etv2 induction, 2

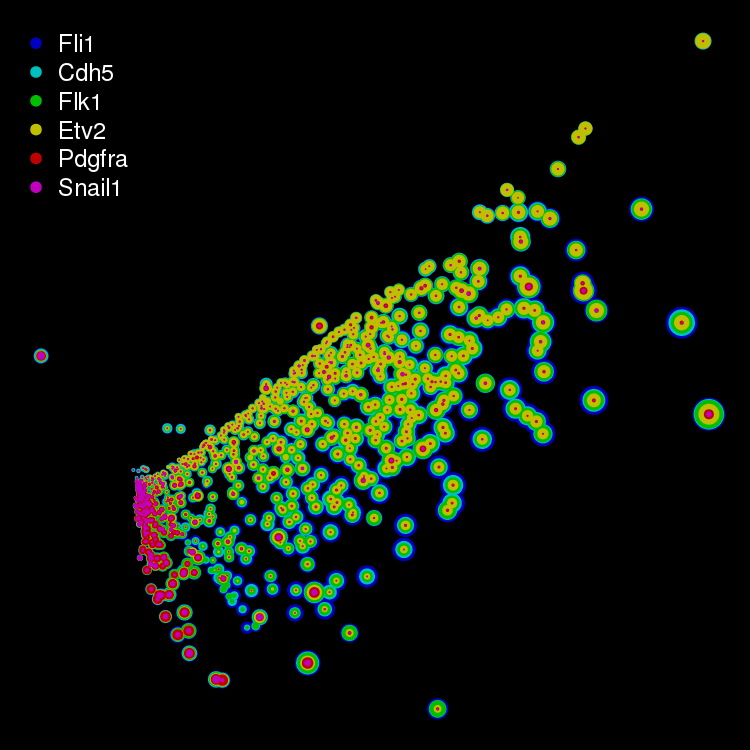
SOD multidimensional mapping of the relationships between the transcriptional identities of 874 cells

Data was obtained as above, but plotted to indicate the transcript densities from all the enumerated genes. The area of the non-overlapping parts of the points is proportional to the transcriptional density for each gene.
Click on image for the scalable svg file.