
SOD (Self-Organising-Deltoids) is a multidimensional scaling algorithm that I initially wrote many years ago in order to to represent the relationship between samples characterised by microarray data analysis.
This algorithm has now been implemented as an extension to the R language and can be obtained from CRAN. For details of this version, please see here.
The source code of the latest development version can be obtained from gitorious. The non-R version can be compiled from the sod subdirectory of the dvreader source code. This has some functionality that the R version lacks but it is not well documented anywhere and I will probably spend more effort on developing the R version. The big advantages of the R version are that the packaging system forces me to document it and that it makes it trivial to combine with more sophisticated analyses.
The idea of the algorithm is very simple: for a set of points in N-dimensional space we can easily calculate the distances between the points; for any given 2-dimensional arrangement of points we can then calculate the errors in the set of distances. These errors are directional and can be used to rearrange the points iteratively. This generally results in a decrease in the total error, but is very prone to being caught in local minima. To overcome this, I introduced a gradual reduction of the dimensionality of the space the points reside in. As the dimensionality is reduced the errors in the system grows and these errors are used to re-arrange the positions during the shrinking of the space.
The first version of this algorithm was written in Perl; later versions were written in C++ with a graphical user interface (GUI) provided by the Qt toolkit. These versions provide a visualisation of the mapping procedure; that was kind of fun, but ultimately not particularly useful. The latest version have been implemented as an extension to the R language. This makes it easy to interface with all the statistical goodness of R. This is especially useful as the algorithm is computationally intensive and the mapping can be speeded up considerably by first performing a principal components analysis (PCA) on the data to be mapped.
SOD is only really useful when there is little correlation between values in the different dimensions; when strong correlation exists the results tend to be very similar to PCA. I initially wrote it because I was unaware of the alternatives, and it seemed a simple way to solve the problem at hand; however, recently I've implemented it as an R-extension because I found it to be useful for summarising single cell gene expression data.
|
|
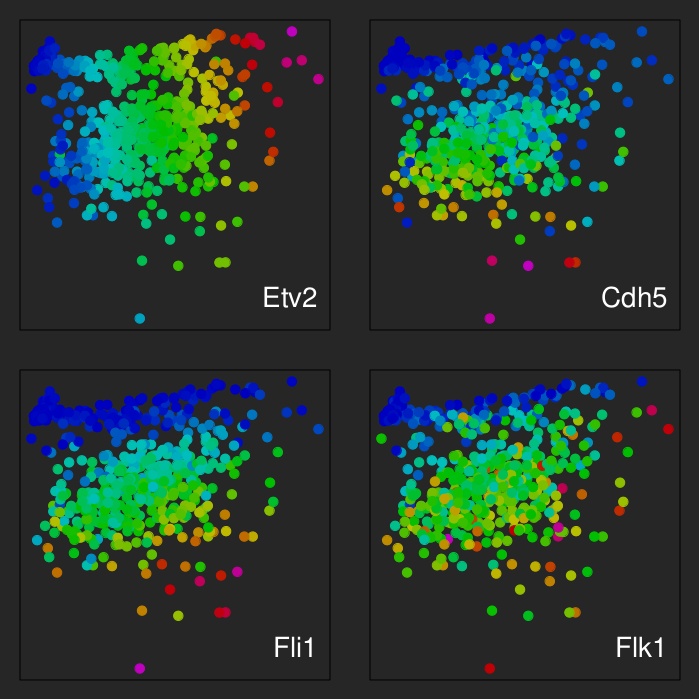
| Visualisation of transcriptional identities of 587 cells analysed by combinatorial FISH against Gata2, Cdh5, Flk1, Fli1, Pdgfra and Etv2. Position indicates transcriptional identity, colours transcript densities for the indicated genes. |
|
|
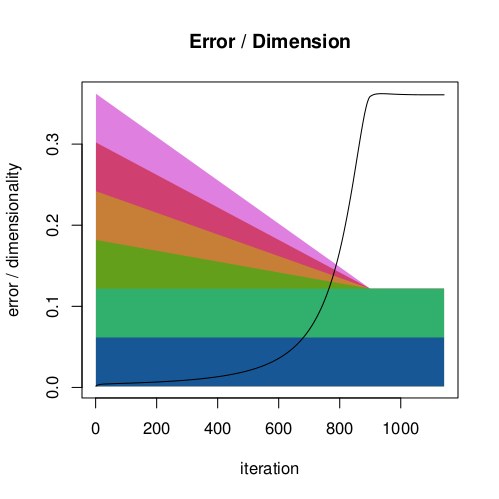
| Plot of the sum of system errors against dimensionality during the SOD mapping process. The dimensionality was gradually reduced from 6 to 2 with the 4 superfluous dimensions being decreased in parallel. |