This window allows the user to select which experiments are displayed by the expresssion viewers and are included in most analytical experiments. Additionally, samples of interest can be selected to be marked in the raw data window to simplify viewing of data. It is also possible to reorder the default viewing order of the different samples.
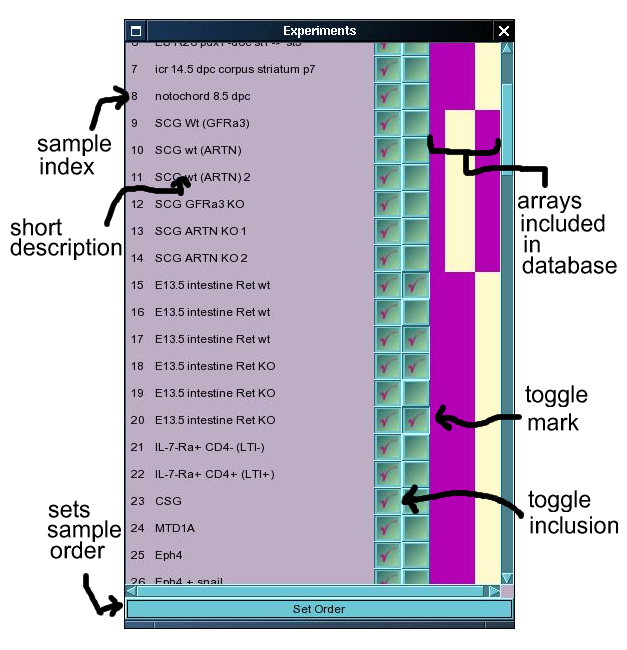
Most functions of the experiment choice window are reasonably self-explanatory. Clicking on the checkbox labelled 'toggle inclusion' toggles the inclusion of a given sample when expression data is plotted as well as for most statistical analyses. Clicking on the checkbox labelled 'toggle mark' causes the expression viewer to mark the x-position of that sample with a red line. This is frequently useful when viewing expression data as it is possible to demarcate areas of the expression plot.
The area to the right of the checkboxes displays a map of the arrays for which data has been included in the database for the given sample. In our current configuration, this map knows about 5 separate chips, the MGU74v2 A, B and C chips, and the MOE430 A and B chips. Purple areas indicate that data is available whereas yellow areas indicate the absence of data. The order of the map entries is, MGU74v2A, MGU74v2B, MGU74v2C, MOE430A and MOE430B. Hence in the current example, the database includes expression data from the MGU74v2A, MOE430A and MOE430B arrays for samples 9-14, and from three MGU74v2 arrays for all other samples displayed in the figure.
It is sometimes desirable to change the order in which the samples are displayed. Currently the default order of display is fixed when the sample is entered into the database, though it is possible to change the order used in the current session. It is not currently possible to save the order used, but this is one obvious thing to include in later releases of the software which should be relatively simple to implement. Pressing the button at the bottom of the Expt. choice window opens the 'Experiment Order Window'.
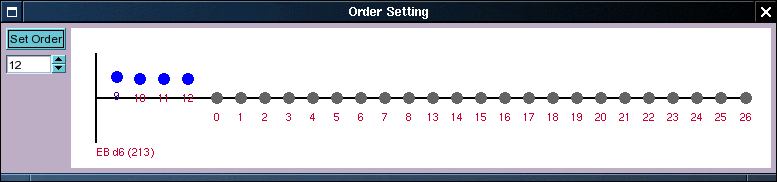
This window is similar to the one used for specifying expression patterns and uses similar semantics. Samples are represented by blobs with the sample index indicated underneath. The size of the blobs can be changed by the little spinbox underneath the 'Set Order' button in the top left hand corner. Active blobs are painted in blue, and these will be moved when any blob is dragged by the mouse. The activity state of blobs can be set either by right-clicking on the blob, or by drawing a region around the blobs whose state we wish to change. Clicking and dragging on a blob activates and moves that blob as well as all other active blobs. At the end of the drag all blobs will revert to an inactive state. It is also possible to activate all blobs using the contextual menu which is activated by right-clicking in the input area. This menu also allows the user to reset the points back to the default order. Click the set order button to set the order. This will initially result in the Expt Choice window to disappear, and then reappear after the order change has been implemented. The new order will be displayed by the Expt Choice window, the expression plot windows, but not by the Probe Data window which will always display the default order. It should be possible in the future to include a function which saves different orders to the database and allows the user to have their own specific default order and to reload various versions of orders. (This could also be used for various subsets of data, but this would require a more sophisticated interface and some more programming on the server backend).