Microarray data is commonly used to cluster genes into groups with similar expression profiles. Although this can be useful for many statistical exercises it does not often seem to provide deeper insight into the biology of the system studied. For this reason we have not tried very hard to provide very good clustering functions, but nevertheless we include a simple K-means clustering function which can be quickly and easily used. Note that reasonable clustering of genes into groups with similar expression profiles quickly becomes more difficult as the sample number, and hence the dimensionality of the system increases.
Important: Do not try to cluster all of the probe sets as, but rather select a set of probe sets which show some reasonable variation across the experimental series (this can be done through the use of the statistics collection and the use of the statistics window).
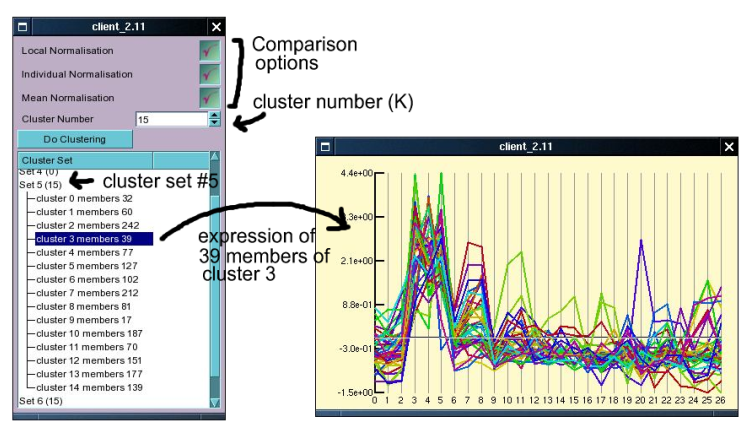
To perform k-means clustering on the currently selected index, click the Clusters button immediately underneath the Profile button in the main window. This will open up a small window (see figure below) into which the the numbers of clusters to be created and a few comparison options can be selected. The number of clusters required will depend on the complexity of the sample, and can not easily be determined and we suggest that the user tries different values for K (the number of clusters) and try the effect. Currently the effect of the three comparison options are a little bit mysterious (I can't quite remember, should check the code base) but we suggest you to leave all of them selected initially. To initiate the clustering click the 'Do Clustering' button. This will send the request to the server, where the clustering will be started in a new thread, allowing the user to keep interacting with the server during the clustering. It is possible, and often desirable to start several clustering processes at the same time to see how different values of K affect the results as well as to judge how reproducible the clustering is. As each clustering process is started in a new thread this is no problem, but note that depending on how powerful your server is this may slow down other processes for yourself and others.
After starting the clustering process wait (or do other stuff in the meanwhile) until one more entries appear in the window underneath the 'Do Cluster' button. Each entry represents the result of one clustering (the number in brackets is the number of clusters). Double clicking on an entry will cause it to expand and show the details of the clusters created. Clicking on anyone of these will open up a window which displays the expression patterns of the members of the cluster (one line per probe set). Right clicking on the expression plot opens up a contextual menu which allows the user to load the cluster member probe sets into the index, or to save these to a file (which can be used for further statistical work).